

people doing cost analysis in a dashboard with charts and graphs, saas website like illustration!!!

people doing cost analysis in a dashboard with charts and graphs, saas website like illustration!!!

Pokémon type chart. Detailed helpful graph.

page scan of fantasy monsters encyclopedia, diagrams and illustrations, insanely detailed, informative texts and graphs
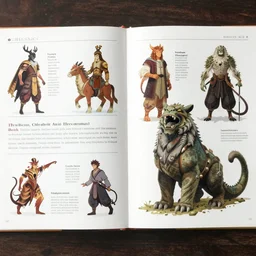
page scan of fantasy characters & monsters encyclopedia, diagrams and detailed color illustrations, insanely detailed, informative texts and graphs

114 graphs together

the image of earth projected onto a waffle with scientific diagrams and math equations and infographics and charts and graphs in a magazine article with text

page scan of fantasy characters & monsters encyclopedia, diagrams and illustrations, insanely detailed, informative texts and graphs

a vector illustration of a graph with five nodes

a vector illustration of a node graph

a powerpoint presentation for a generic business showing quarterly reports. the data includes graphs and numbers. the content is boring and annoying.

website landing page for a saas company

trading view chart analysis

a vector illustration of a graph neural network

tableau dashboard

zoomed - in page scan of fantasy characters & monsters encyclopedia, diagrams and detailed color illustrations, insanely detailed, informative texts and graphs

zoomed - in page scan of fantasy characters encyclopedia, diagrams, insanely detailed, informative texts and graphs, illustration with detailed text on a side

business dashboard with time series charts, pie plots and other modern graphics, with small creatures swimming on it. diego rivera ( in ukiyo - e style )

the image of earth projected onto a waffle, with scientific figures and infographics and charts and graphs, magazine article

closeup scan of the page of encyclopedia coloured clean sharp illustration : : fantasy architecture, diagrams showing various fantasy architecture styles, insanely detailed, informative texts and graphs

business dashboard with time series charts, pie plots and other modern graphics, with small creatures swimming on it. diego rivera ( ukiyo - e influence )

zoomed - in page scan of fantasy characters & monsters encyclopedia, diagrams, insanely detailed, informative texts and graphs, illustration with detailed text on a side

small creatures swimming in a dashboard with time series charts, pie plots and other modern graphics. diego rivera ( in ukiyo - e style )

scatter graph

linear regression, graph